Biologists can't deviate from their objective to make a detailed study of available resources while choosing bioinformatics resources for their specific needs. In fact, the selection of databases and tools has often been very unscientific. A few scientists in 'Shodhaka', who formed a non-profit virutal association called BdataA has initiated a need-based categorization of the resources to assist scientists, and brings you the initial results, after several years of research, in the form of a web-portal. The unique features would make the newly created portal a very useful starting point for most biologists bioinformatics work.
- Usage frequency of each resource
- Extensive categorization of resources based on the need of biologists
- Most exhaustive list of resources along with important features
- Suggested readings for the application areas compiled for beginners or other researchers
- Original research to systematically compare the resources from biologists perspective in certain cases
- PubMed, PubMed Central, Google Scholar and Google were used to compile a list of resources for each type of bioinformatics analysis.
- The working status of each of the resource was manually checked on multiple occasions.
- The usage frequency was estimated for each tool.
- The lists at this stage were considered the post-survey lists without feature-verification, as we relied upon what is told by the creators of the resources.
- Broad categories of applications were created for each type of analysis and the tools were grouped under different needs.
- Feature verification was done using each resource for a case study (post-survey lists after verification) in some cases.
- Detailed comparative analysis have been initiated from biologists perspective, in a few cases. Example: Akhilesh B, Sravanthi D, Haritha H, Greta K, Deepti, Sreelakshmi KS, Darshan C, Pranami B, Mohammed F, Neelima C, Samudyata V, ArunNehru KP, and Acharya, KK. In search of the right literature search engine(s). Nature Preceedings:
- A specific format is made for the biologists to store the information about the bioinformatics resources and database created to store gathered information, which is then linked to the newly created web-portal.
The resources are ranked based on their "usage frequency" (widely-used being 1st and less-used being 100th rank). Two approaches were followed to derive the usage frequency ranks.
Manual approach: It is the average of the ranks calculated by each of the following estimation methods. Method 1: estimating the number of articles containing the resource-name along with the application-related terms. Method 2: estimating the citations of the resource-reporting article(s). Method 3: estimating the number of articles containing the URL(s) of the resource. Google Scholar - a full text search engine, which was earlier found suitable for such searches (http://dx.doi.org/10.1038/npre.2011.2101.3), was used to obtain the hits (frequencies) by using appropriate query term(s) in each of the methods. All the searches were performed manually, and restricted to last two years.
Rank derived from manual approach was validated for a few application areas. For each resource, the rank obtained from usage frequency derived by manual screening (20, wherever applicable) of relevant hits retrieved in method 1 was compared with that of the final average rank. The usage frequency rank obtained by this method correlated with average ranks of all the three methods (method 1-3), in most cases.
Automated approach: It is the average of the ranks calculated from usage frequencies estimated automatically by Method 1 and Method 3 (as described in manual approach). An internal program was run to perform the searches in HighWire Press (As HighWire Press is not available since few years, currently PubMed Central is being used). All the searches were restricted to last two years.
The ranks derived from automated approach were compared with those derived from manual approach. The results across different application areas indicated that, on an average for about 80% of resources there was no variation in the ranks derived from both the approaches. Since the manual approach is time taking and laborious, and difficult to update frequently, we have come up with this automated approach that would be updated every three months. Efforts will be made to update the ranks by manual approach every three years.
All the resources except for preliminary-lists have the usage frequency ranks calculated by both manual and automated approaches. Whereas, resources listed under preliminary-lists have ranks calculated only by automated approach.
Usage frequency derivation:
Manual approach:
The usage frequency was calculated by using three methods:
- Method 1: Total number of hits obtained in Google Scholar over last two years by querying a uniform query-set with each resource name (e.g., dbSNP) and field (e.g., single nucleotide polymorphism), was considered as the usage frequency for a specific resource.
Note: Depending on the resource name, multiple queries were designed and searched uniformly for all the resources, and the average hits obtained were considered as the usage frequency for each resource. For example., in case of resources with general names such as MINT, DIP, IntAct., two queries were designed to use along with field, one having the short title of the resource (e.g., DIP) and the other having full title (e.g., "Database of interacting proteins"). This was followed uniformly for all the resources wherever applicable, and the hits obtained from multiple queries in each resource were averaged to get the final usage frequency per resource. - Method 2: Total number of citations obtained in Google Scholar over last two years by querying the article(s) reporting the resource, was considered as the usage frequency for a specific resource. Note: In case of multiple articles reporting the same resource, citations for all the articles were summed up and considered as the final usage frequency for that specific resource.
- Method 3: Total number of hits obtained in Google Scholar over the last two years by querying the URL(s) of the resource, was considered as the usage frequency of a specific resource.
Note: In case multiple URLs exist for the same resource, citations for all the URLs were summed up and considered as the final usage frequency for that specific resource.
The usage frequencies thus obtained were used to rank the resources in a scale of 1-100. Interval Size (IS) was determined by subtracting the minimum number from the maximum number of usage frequencies obtained in each method, and dividing it by 100. Ranks were assigned for each interval based on the usage frequencies where they fall into. Resource(s) with highest usage frequency within the first interval were assigned as rank 1 and the resource(s) with next highest usage frequencies within the next intervals were assigned as rank 2, and so on. Average rank from three methods was considered as the final usage frequency rank of each resource.
Note: In case of manual approach, if the average rank of any two methods varies 40 % and more, the usage frequencies for those resources derived by all the three methods were revised by performing manual screening (to derive the relevant hits) of 20 hits and extrapolating it to the total hits. The revised usage frequency was considered for calculating the rank.
Usage frequency rank derivation (manual approach, an example shown below):
Search engine: Google Scholar; limits: since last two years
- Method 1:
"MiMI" AND ("protein interaction" OR "protein interactions" OR "interacting proteins") AND (database OR databases OR software OR tool OR tools OR resource OR resources OR server)
Hits: 162
Michigan Molecular Interactions" AND ("protein interaction" OR "protein interactions" OR "interacting proteins")
Hits: 72
Final usage frequency by method 1: (162+72)/2 = 117
Highest usage frequency among all the resources: 16800 and lowest: 0; interval size was 168 [(16800-0)/100]. Usage frequencies from 0 - 168 falls in rank 100.
Usage frequency rank by method 1: 100 - Method 2:
Number of citations for article 1 [Michigan Molecular Interactions (MiMI): putting the jigsaw puzzle together]: 43
Number of citations for article 2 [Michigan molecular interactions r2: from interacting proteins to pathways]: 26
Number of citations for article 3 [MiMI: Michigan molecular interactions]: 0
Total citations: 69
Final usage frequency by method 2: 69
Highest usage frequency among all the resources: 1731 and lowest: 0; interval size was 17 [(1731-0)/100]. Usage frequencies from 53 - 69 falls in rank 97.
Usage frequency rank by method 2: 97 - Method 3:
URL used: "http://mimi.ncibi.org"
Number of hits: 25
Final usage frequency by method 3: 25
Highest usage frequency among all the resources: 674 and lowest: 0; interval size was 7 [(674-0)/100]. Usage frequencies from 21 - 27 falls in rank 97.
Usage frequency rank by method 3: 97
Final usage frequency rank: (100+97+97)/3 = 98
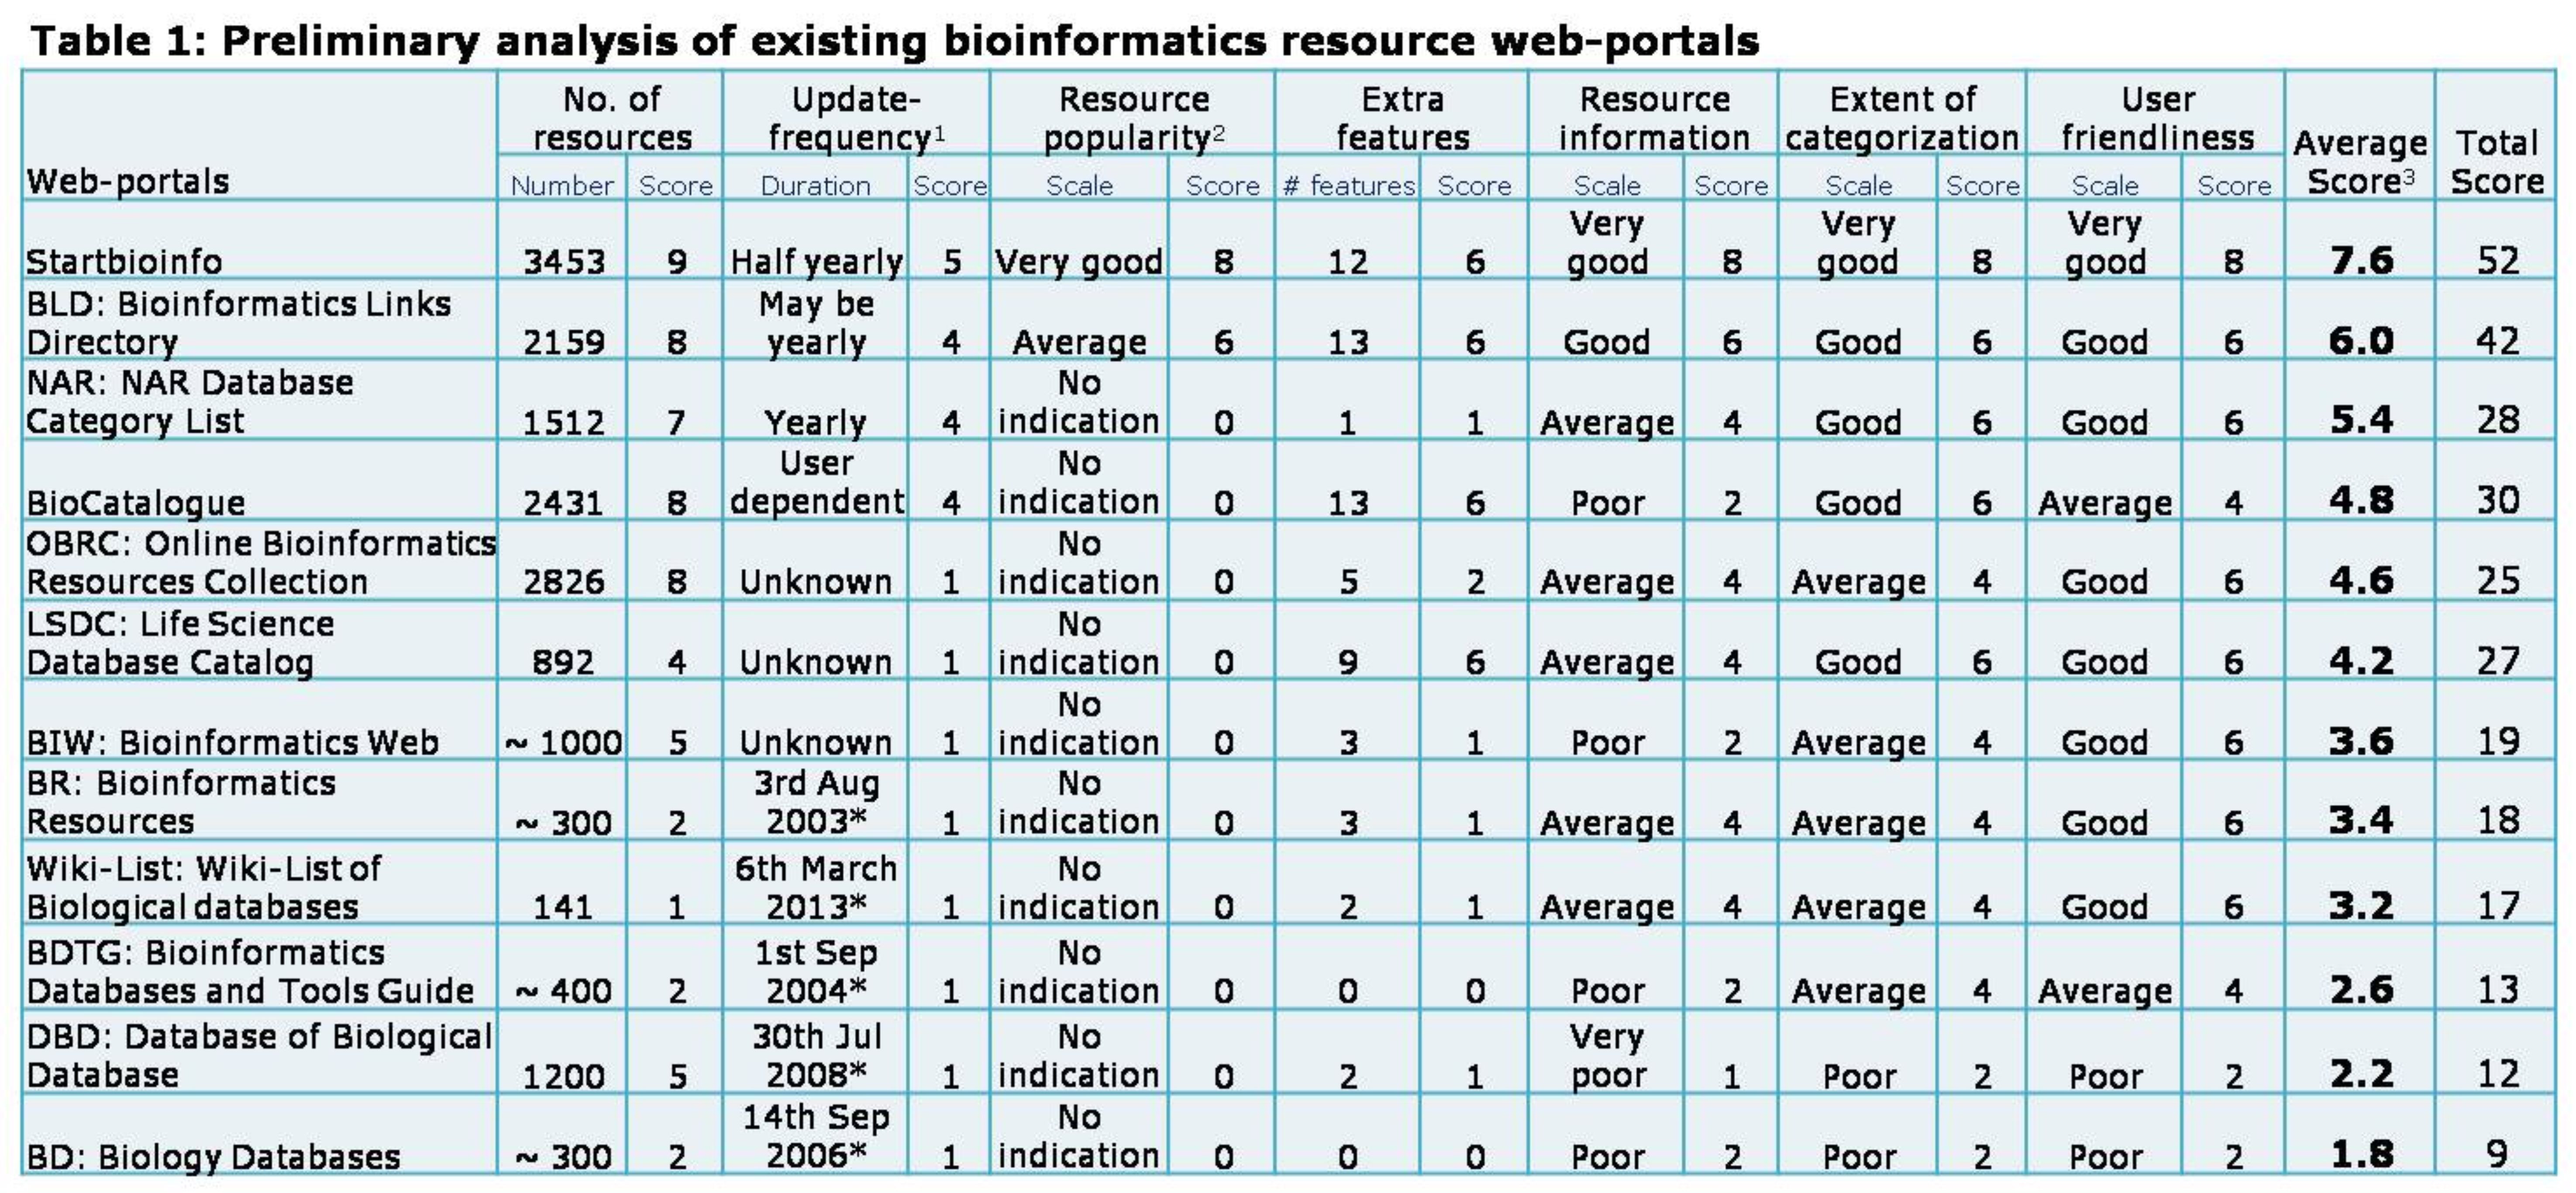
The results provided here are based on the statistics of the web-portals as on March 2013.
1Update-frequency in case of BioCatalogue is user dependent, and hence was considered equivalent to yearly scale.
2Resource popularity is indicated by usage frequency rank in case of Startbioinfo, and Links Directory Index in case of Bioinformatics Links Directory.
3Parameters common to all the web-portals were considered for average score calculation and hence, "resource popularity" and "extra features" were not considered.
*Last updated date as specified by the portal. Since there was no information on update-frequency, it was considered equivalent to unknown. Refer Table 2 for detailed scoring method.
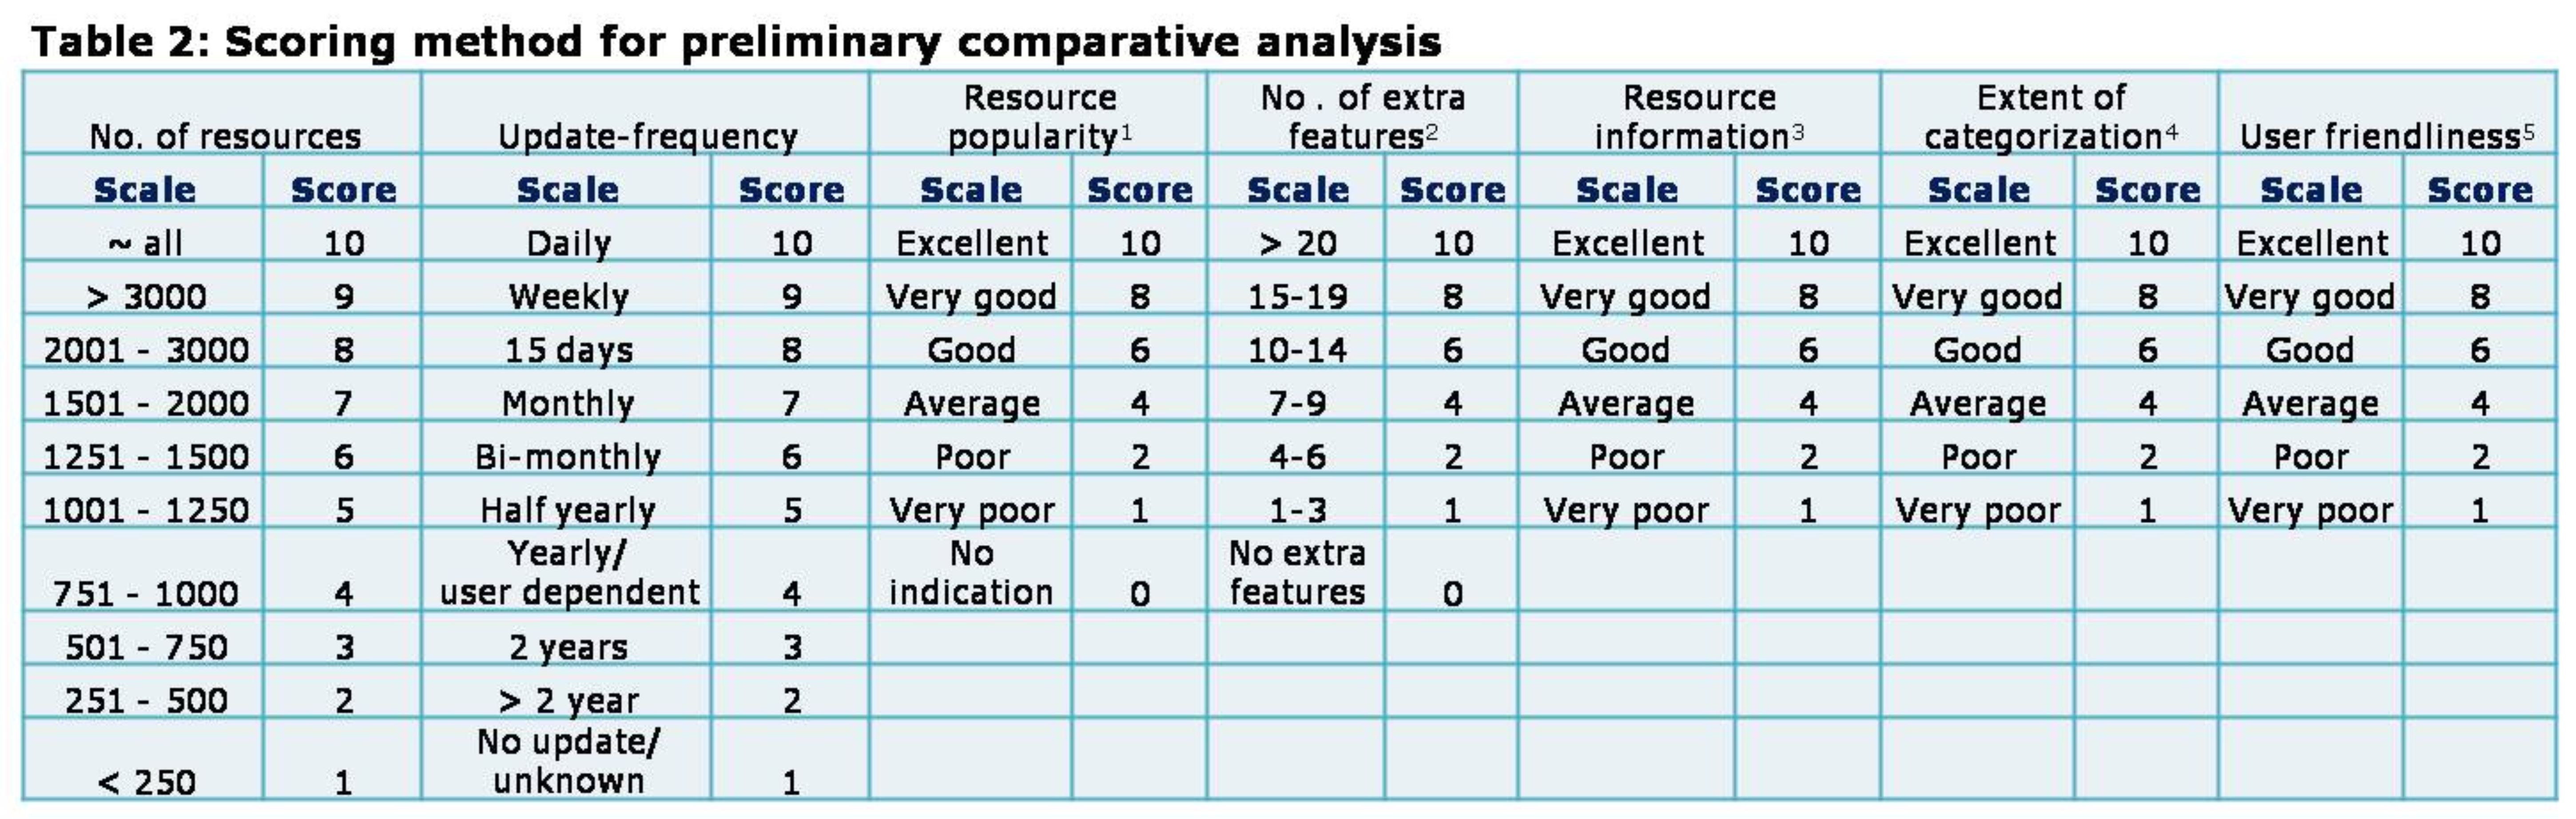
1Poor to excellent corresponds to the level of indication of usage/popularity of resources. Resource popularity is indicated by “usage frequency rank” in case of Startbioinfo, and “Links Directory Index” in case of Bioinformatics Links Directory.
2Extra features included: country wise categorization of resources, reading material (reviews, comparative studies, etc) related to the application areas, links/login through other social networking sites, thumbnail images of the resources, daily updates on working status of resources, information on bioinformatics journals, option to view all broad application tags of resources, filtered PubMed search for articles on application areas, download option, editing/adding information by user, updates on access of resources.
3Poor to excellent corresponds to the amount of information provided for each resource. Information included: important features, citation, year of publication, working status, URL, availability status, system compatibility, input & output formats, additional comments, etc. 4Poor to excellent corresponds to the level of categorization ranging from a broad to specific levels.
5Poor to excellent corresponds to the features of web-portal such as easiness in querying, interpretation, speed, and output features.
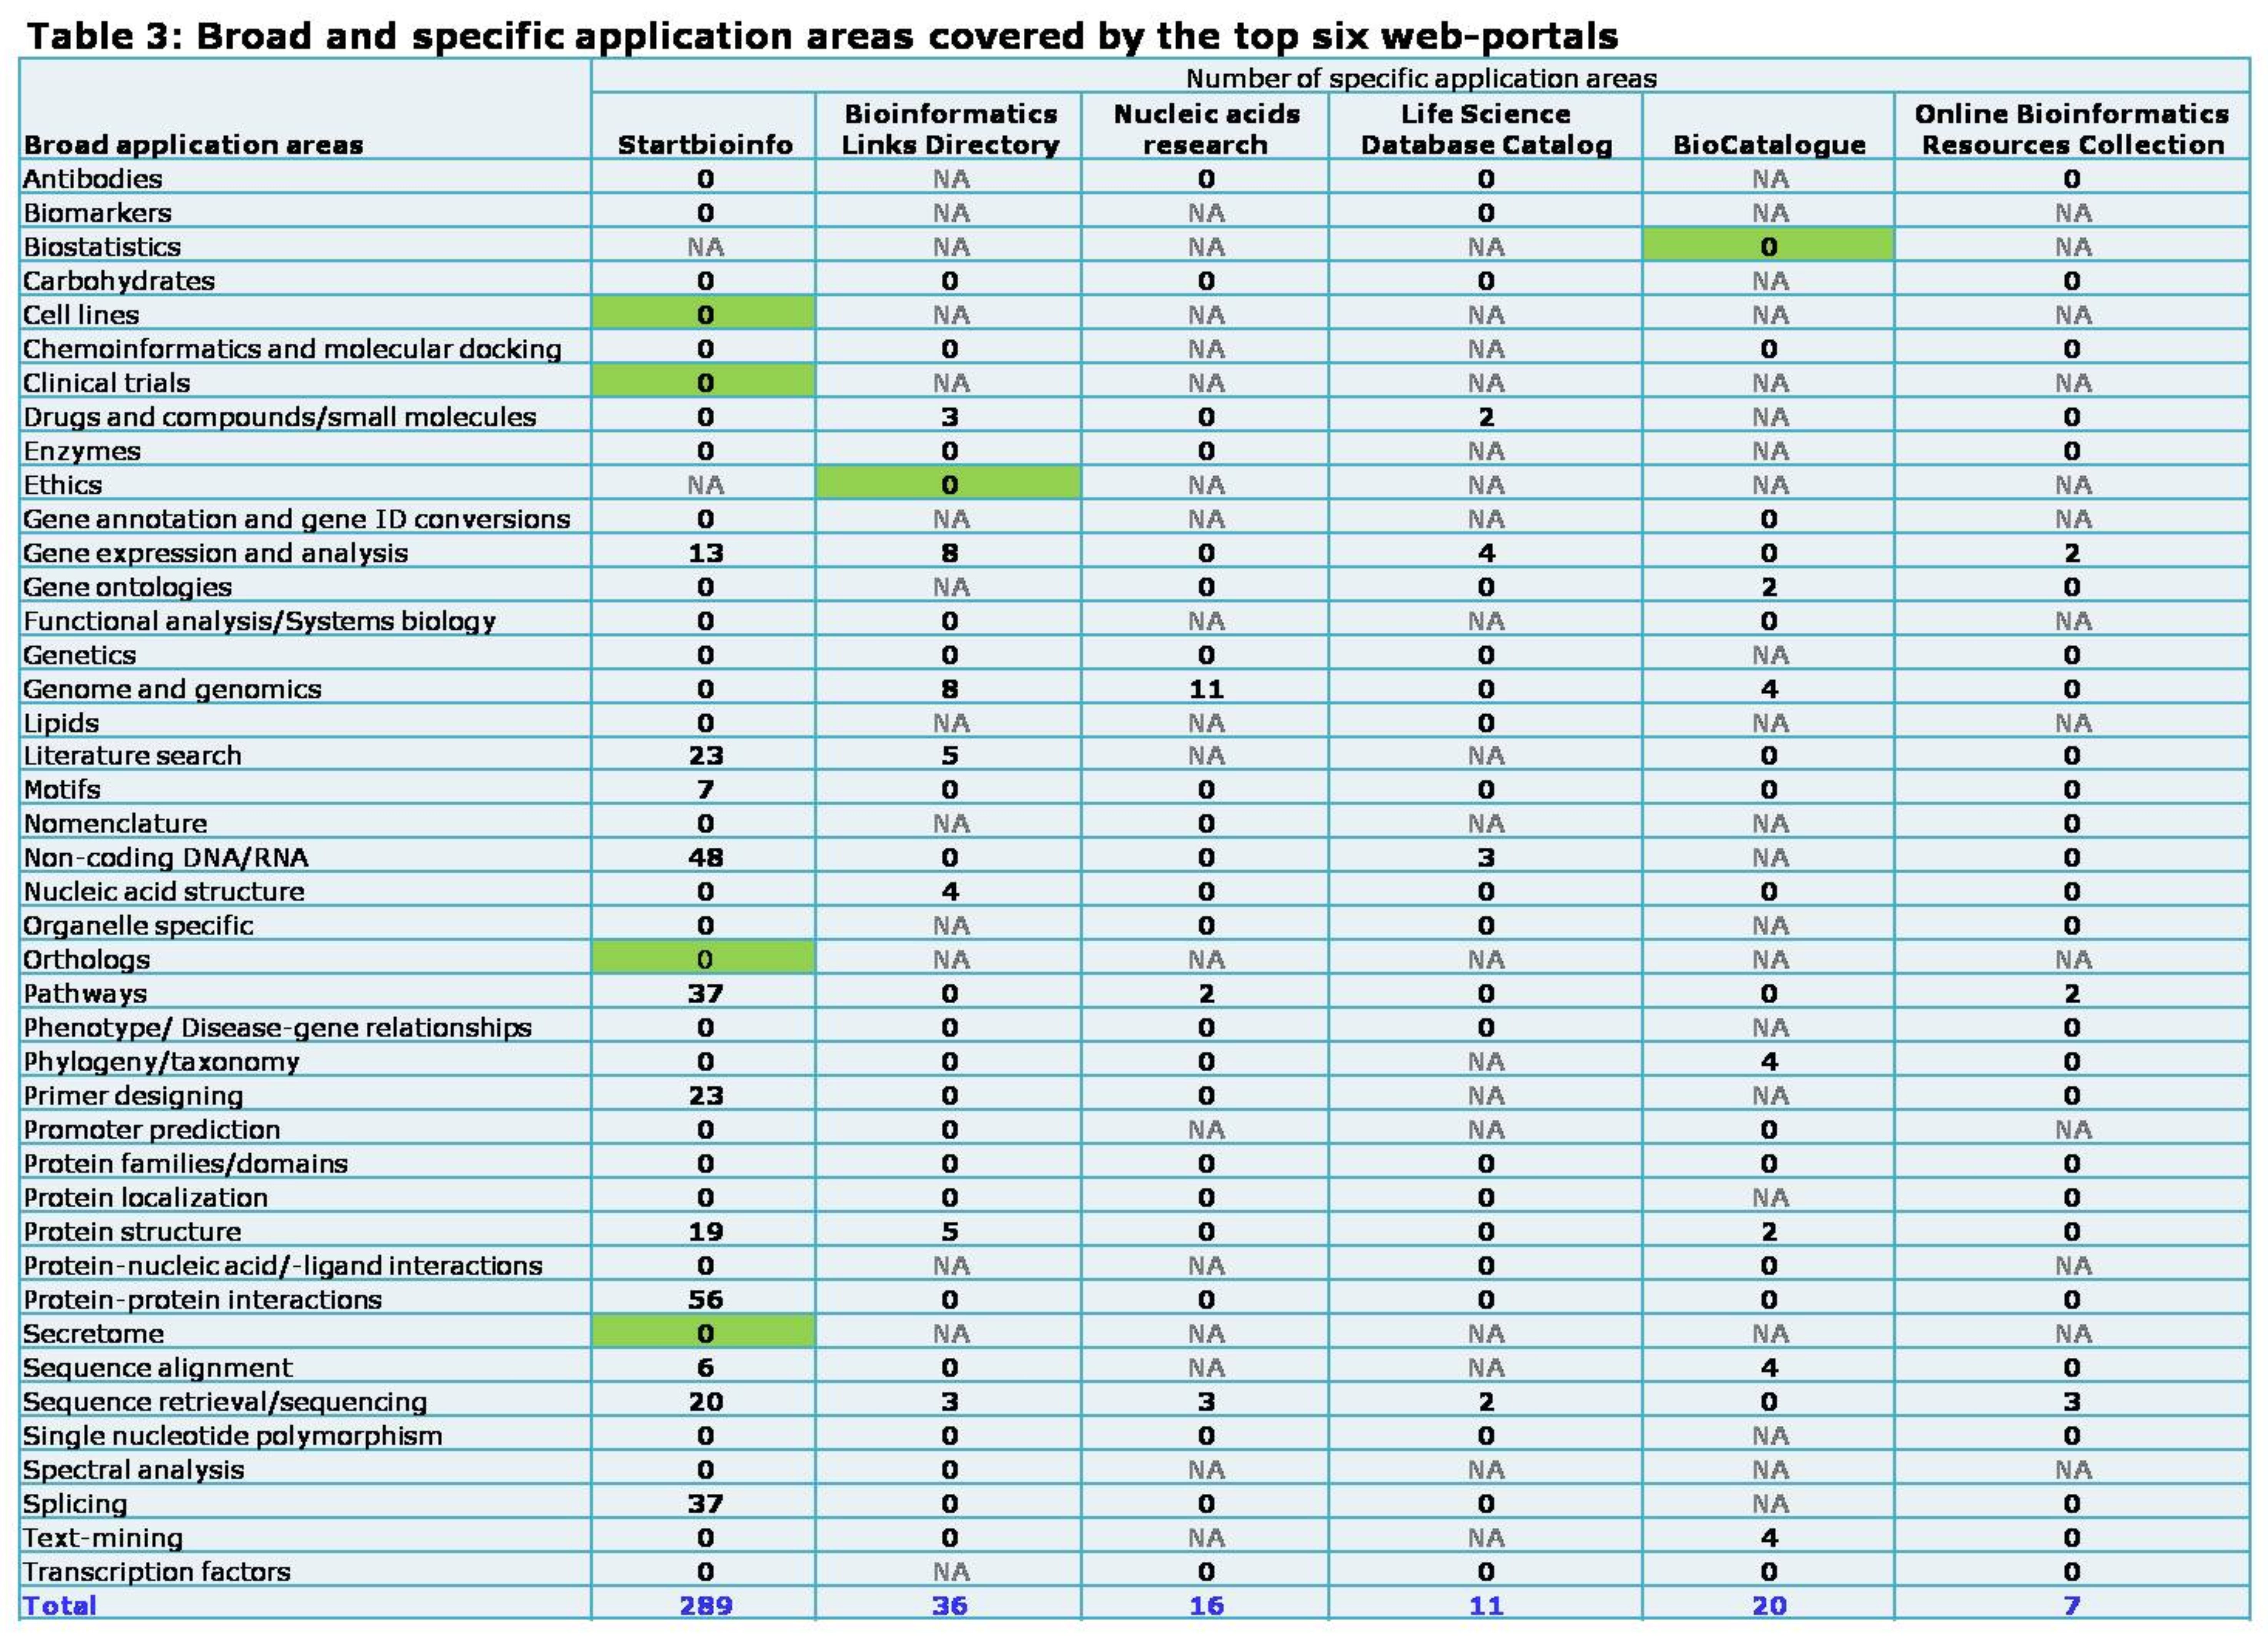
The top six web-portals in the preliminary analysis refer(Table 1) were considered for this comparison; NA: not applicable, when there is no corresponding broad application area; cells highlighted in green indicate the exclusive application area covered by the corresponding web-portal.